2002 Mass Bleaching Event
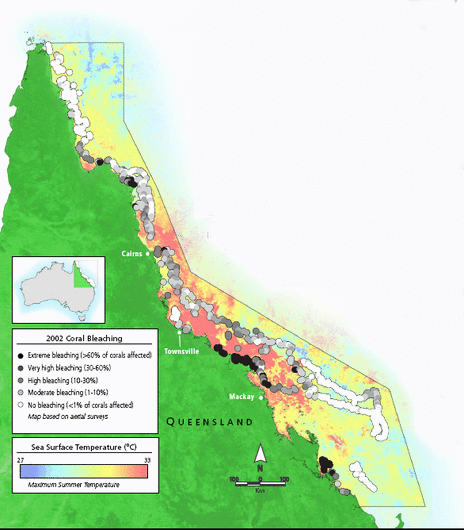
Map from aerial surveys after the 2002 bleaching.
2002 saw a severe bleaching event that is seen to be the strongest and worst on record, this is because more area of reef was affected with a larger number of offshore reefs affected. Unlike the 1998 event it was not associated with the ENSO movement and rather just with the warming of the sea (cRc). It started in January and continued through until April when the worst of the bleaching had taken place. According to the GBRMPA 54% of corals bleached to some extent with 18% strongly affected. As you can see in the map the overall temperature of the sea was a lot higher along the centre of the reef where a lot of the very high or extreme bleaching has occurred. Around the edges of the reef the sea level only increased slightly and is still very close to the average temperature it would be during that time of year. The Australian Government have a useful section on their website where you can see the ocean temperatures plotted against the average over the last 8 years. Click Here. It shows the average temperature trends of each year against the actual temperatures.
